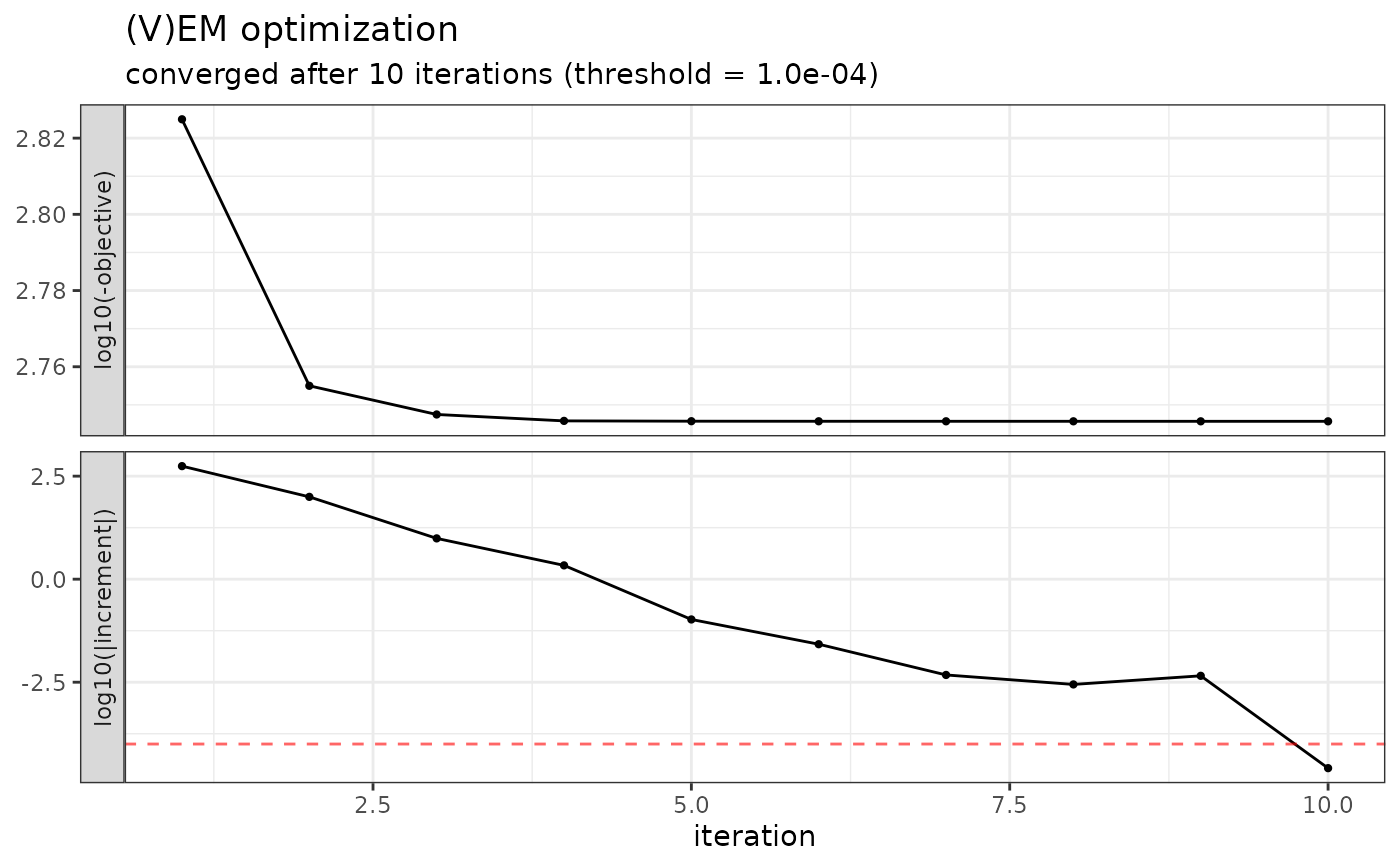
Plots the evolution of the objective (log-likelihood or ELBO) across the (V)EM iterations of the last call to `optimize()`, see `$plot_loglik()`.
Usage
# S3 method for class 'NormalBlockVarBase'
plot(x, ...)Examples
ex_data <- generate_normal_block_var_data(n = 50, p = 20, d = 1, q = 3)
data <- NormalBlockData$new(ex_data$Y, ex_data$X)
model <- normal_block(data, blocks = 3, control = NB_control(verbose = FALSE))
plot(model)