library(tidyverse)
theme_set(theme_bw())Detection of change points in a time series
Exercices
Preliminaries
1 Detection of changes in the CAC 40 index
The Figure below displays the CAC 40 index during a given period of time.
read_tsv(file="../../data/CAC40data.txt") %>%
  ggplot() +  geom_line(aes(time,y), color="#6666CC") +  ylab("CAC 40 index")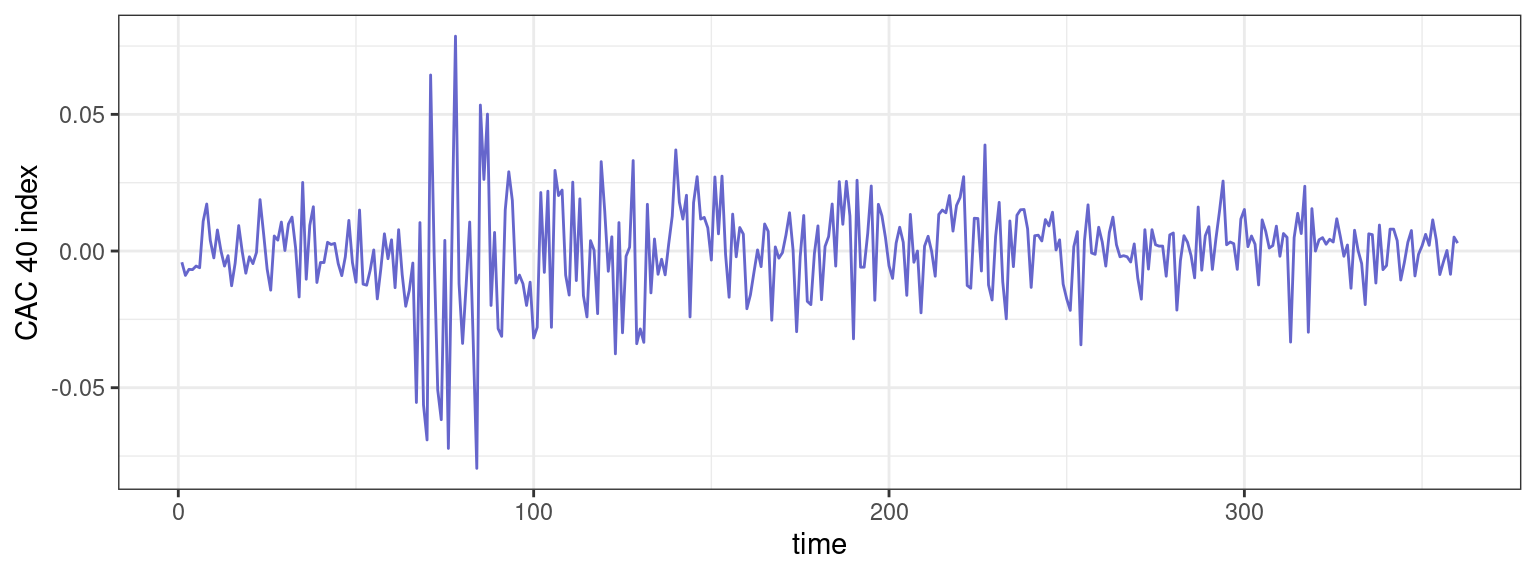
- Assuming a piecewise constant volatility, propose a mathematical model for this data.
- Extend the dynamic programming algorithm for this model.
- Propose a segmentation of the CAC 40 index.
2 Segmentation of array CGH data
The purpose of array-based Comparative Genomic Hybridization (array CGH) is to detect and map chromosomal aberrations, on a genomic scale, in a single experiment. Since chromosomal copy numbers can not be measured directly, two samples of genomic DNA (referred to as the reference and test DNAs) are differentially labelled with fluorescent dyes and competitively hybridized to known mapped sequences (referred to as BACs) that are immobilized on a slide. Subsequently, the ratio of the intensities of the two fluorochromes is computed and a CGH profile is constituted for each chromosome when the log2 of fluorescence ratios are ranked and plotted according to the physical position of their corresponding BACs on the genome.
Each profile can be viewed as a succession of “segments” that represent homogeneous regions in the genome whose BACs share the same relative copy number on average.
read_delim(file="../../data/CGHdata.txt", delim = " ") %>%
  ggplot() +  geom_point(aes(position, y), color="#6666CC") +  ylab("fluorescence")
Rows: 93 Columns: 2
── Column specification ────────────────────────────────────────────────────────
Delimiter: " "
dbl (2): position, y
ℹ Use `spec()` to retrieve the full column specification for this data.
ℹ Specify the column types or set `show_col_types = FALSE` to quiet this message.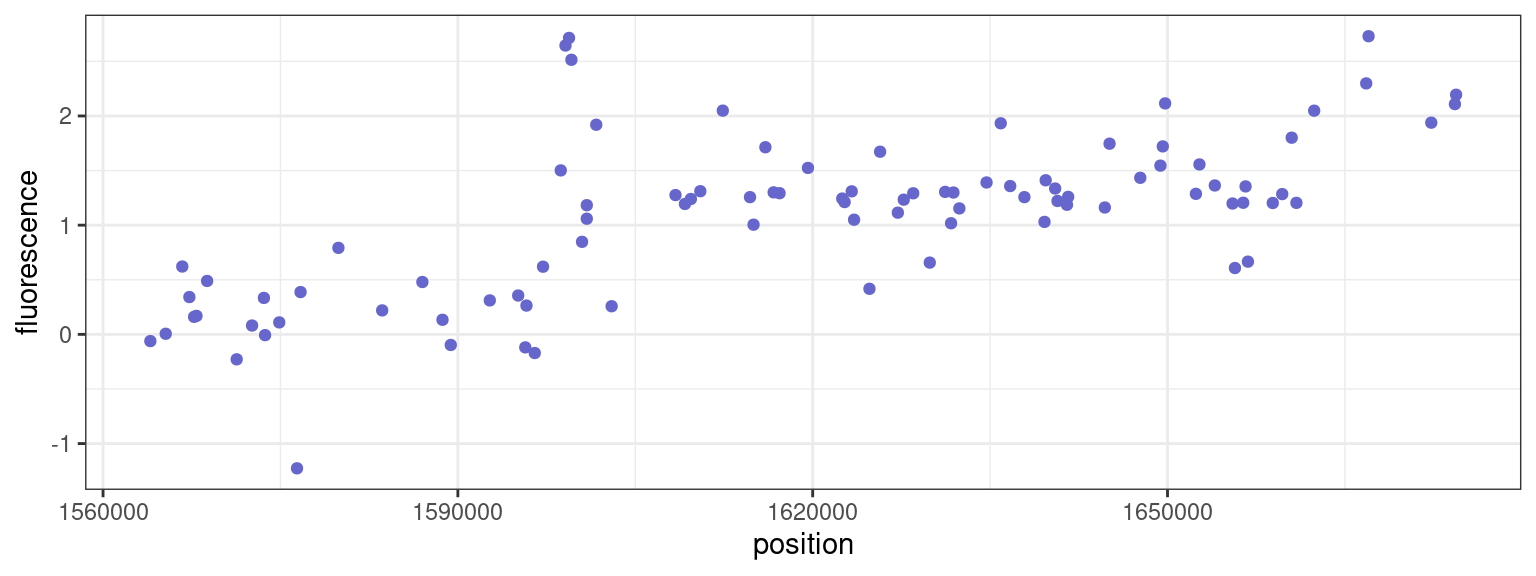
- Assuming that both the central value and the variability of the data are both piecewise constant, propose a mathematical model for this data.
- Extend the dynamic programming algorithm for this model.
- Propose a segmentation of the CGH profile.
3 Testing the presence of a change point
Consider the well log data data between t=651 and t=950:
read_tsv(file="../../data/wellLogData.txt") %>% slice(651:950) %>%
  ggplot() +  geom_point(aes(time,y), color="#6666CC") +  ylab("nuclear reponse")
Rows: 1267 Columns: 2
── Column specification ────────────────────────────────────────────────────────
Delimiter: "\t"
dbl (2): time, y
ℹ Use `spec()` to retrieve the full column specification for this data.
ℹ Specify the column types or set `show_col_types = FALSE` to quiet this message.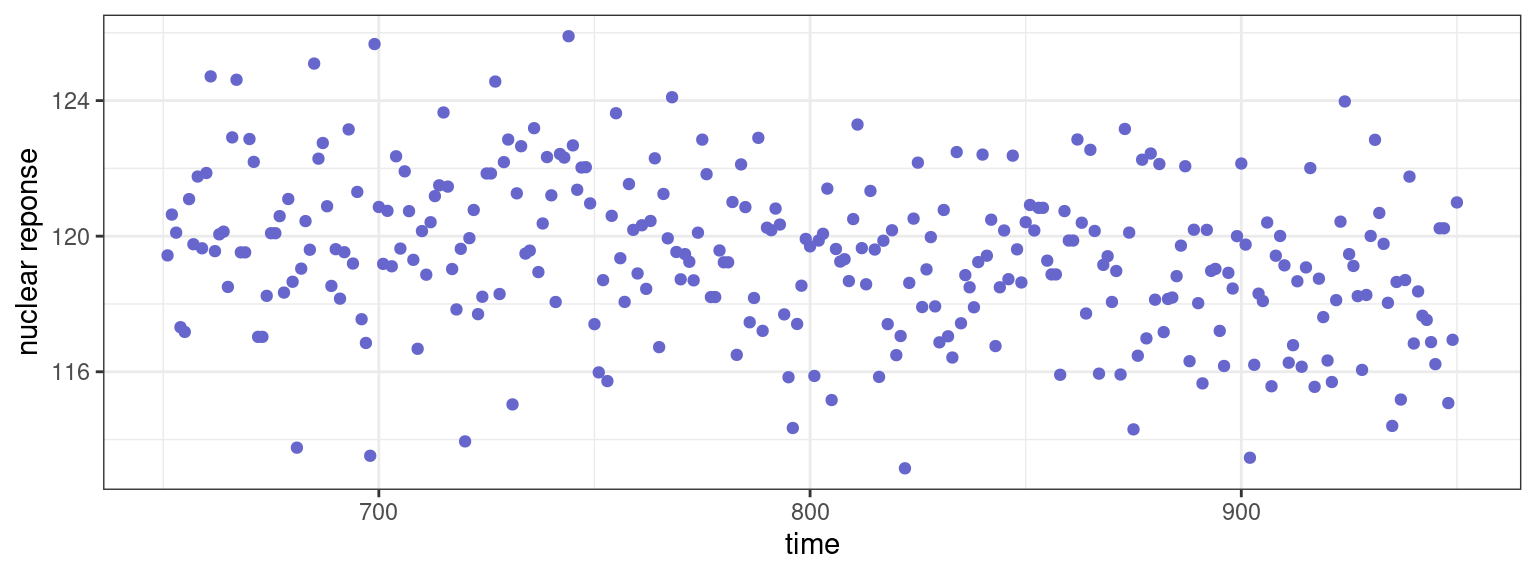
- Test if the mean changes at time t=750. Test if the mean changes at time t=850. What can we conclude from these two tests?
- Test if the mean changes somewhere between t=651 and t=949.